

If there is a single number that justifies port equipment tracking as a budget line, it is this: between 2020 and 2022, shipping lines collected roughly $6.9 billion in demurrage and detention charges from cargo owners. That money did not come from ships stuck at sea. It came from containers sitting in port yards, invisible to the people paying fees on them.
Port equipment tracking covers everything that moves inside a marine terminal: ship-to-shore cranes, rubber-tired gantry cranes (RTGs), straddle carriers, automated guided vehicles (AGVs), chassis, drayage trucks, and the containers themselves. When any of those assets goes dark for even a few hours, cost compounds. Detention charges. Idle equipment. Missed vessel windows. Stolen cargo.
Global ports handled 920 million TEUs in 2024, a 6.9% year-over-year jump. Volume is not slowing. But the tracking infrastructure at most terminals still trails throughput growth. I have spent 15+ years integrating IoT systems across aviation, freight, and maritime, and the pattern I keep seeing at ports mirrors what I watched in MRO hangars a decade ago: operators invest in a single tracking technology, expect it to blanket the entire yard, then wonder why their container inventory goes stale by midshift. The problem is never the device. It is the architecture.
What Port Equipment Tracking Actually Covers
When a 14,000-TEU vessel berths, the assets involved in unloading, sorting, stacking, and dispatching cargo span at least six equipment classes. Each has different movement patterns, power profiles, and failure modes.
- Ship-to-shore (STS) cranes do not travel far, but their spreader-cycle counts and maintenance windows define terminal throughput. Konecranes, the world’s largest port equipment OEM, offers TRUCONNECT remote monitoring to track these metrics across entire fleets.
- RTGs and eRTGs stack and retrieve containers in the yard. Sensor suites from ifm capture load weight, spreader position, and operator inputs in real time.
- Straddle carriers and reach stackers shuttle containers between stacks and trucks. Typically tracked by GPS/cellular telematics, they lose signal under dense stacking.
- AGVs operate in automated terminals like PSA’s Tuas Mega Port, where ST Engineering’s vehicles carry up to 65 tonnes at 25 km/h, fully autonomous. Tracking is embedded at the design level.
- Chassis and trailers are the most frequently “lost” asset class. A chassis that drifts out of a pool without a tag can sit at an inland depot for weeks before anyone notices.
- Containers, loaded and empty. Empty containers account for roughly 20% of port traffic. Repositioning them without visibility is pure margin drain.
One device cannot cover all six classes. An RTG does not need the same sensor as a chassis leaving the terminal gate. A chassis needs cellular connectivity for inland travel. An AGV inside a fenced yard needs centimeter-level precision. The asset dictates the technology. Not the other way around.
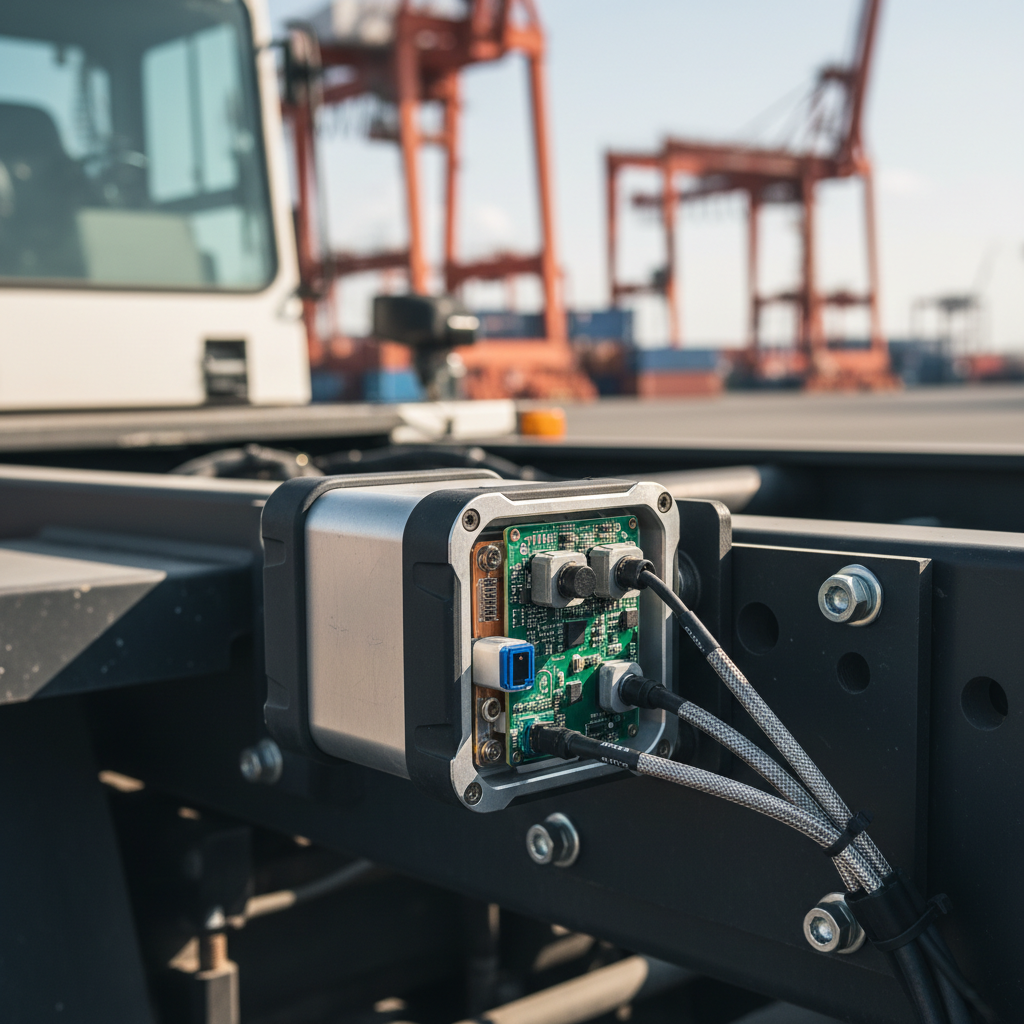
The Seven Technology Layers in a Modern Terminal
Here is the stack as it exists in well-instrumented ports today. Not a vendor comparison, but a map of which layer does what and where each one breaks.
| Layer | Examples | Best For | Key Limitation |
|---|---|---|---|
| GPS / GNSS | Cellular IoT trackers | Drayage trucks, containers leaving the terminal | No indoor/yard-stack coverage; cellular dead zones |
| Active RFID | Battery-powered tags (~100m range) | Chassis at portals, RTG-mounted assets | Battery lifecycle management |
| Passive RFID | EPC Gen 2 tags (5-10m range) | Gate-in/gate-out ID, pallet tracking | Portal infrastructure required; read rate drops under stacking |
| BLE / UWB | Bluetooth Low Energy, ultra-wideband | Crane last-50m precision, intra-yard equipment | Short range; high receiver density needed |
| Computer Vision | AI cameras, OCR systems | Container ID, damage detection, tamper alerts | Weather, lighting, and motion blur affect accuracy |
| TOS / YMS | Kaleris N4, Tideworks Mainsail, OPUS | Yard orchestration, crane dispatch, gate sequencing | Heavy integration; decade-long upgrade cycles |
| Telematics SaaS | Fleet dashboards | Truck and equipment monitoring | Relies on carrier APIs for container-level data |
The PEMA RFID in Ports and Terminals information paper documents passive RFID portal read rates of roughly 95% in controlled conditions. Under high stacking, occlusion, and rain, that drops fast. GPS and RFID are not competing technologies. They are complementary: GPS gives outdoor absolute position, RFID gives portal identification at lower power cost.
Computer vision has changed fastest. Multiple vendors now mount AI cameras on lift equipment to identify containers inside dense stacks and deliver “never-stale” inventory data. AllRead.ai out of Spain offers container-number recognition with real-time anomaly detection. These solutions address the loudest complaint in yard operations: inventory that is shifts out of date, not minutes.
No port I have worked with runs fewer than three of these layers simultaneously. Terminals that try to consolidate into a single technology always end up with blind spots: at the gate, inside the stack, or during the drayage handoff.
Shipment Tracking Stops at Delivery. Asset Tracking Does Not.
Most visibility platforms on the market solve shipment tracking: where is this container now, what is its ETA, has it cleared customs. The job ends at delivery.
Port equipment tracking is a different discipline. It follows the chassis after the driver drops a load and returns to the pool. It monitors the RTG through its maintenance cycle and back to service. It tracks empty containers from yard to depot and back onto a vessel, and even extends to knowing how to track a boat at sea once the vessel departs. The work does not stop at delivery. It continues through return, dwell, maintenance, reuse, tying equipment visibility directly into broader port logistics operations.
Hapag-Lloyd reported in September 2025 that more than 85% of its dry container fleet now carries a GPS-enabled IoT device. That is significant shipment-level coverage. But the carrier’s tag tells you where their container is. It does not tell you where your chassis went after the driver decoupled, or whether the RTG that stacked the box is burning hours on a stuck spreader.
If your container pool or equipment fleet feels invisible after delivery, that is precisely the gap asset tracking closes.
Where the Money Bleeds
Three cost drivers turn port equipment tracking from a technology experiment into a financial priority.
Demurrage and detention hit first. Per-container demurrage runs $75 to $300 per day in 2026, depending on carrier and port. Detention for chassis and containers held past free time reaches $30 to $150 per hour. CMA CGM charges around $719 per container after a 14-day dwell. Scale that across a terminal handling thousands of boxes daily and you see how the industry bled $6.9 billion over three years.
Cargo theft is accelerating. The National Insurance Crime Bureau reported losses rose 27% in 2024, with estimated annual losses reaching $35 billion. Ports and rail yards are the most common theft locations. Munich Re’s 2025 cargo theft report found 41% of thefts happen in transit and 21% in warehouses. Strategic theft (cyber-enabled carrier impersonation) now accounts for nearly one-third of US incidents. Position-only trackers are not enough anymore. Tamper detection, door sensors, light sensors, and GPS-jamming alerts are what flag an abnormal event before cargo leaves the port.
Equipment idle time is the least visible cost, but it compounds quietly. An RTG crane offline for an unplanned repair idles every container move that would have happened during the downtime. Average truck turn time at the Port of Los Angeles runs 60 to 70 minutes under normal conditions. When yard equipment goes down untracked, those turn times spike and detention charges follow.
These are operational dollars. Every one of them is recoverable with better asset visibility.
What the Leading Ports Are Doing in 2026
The terminals investing most aggressively in port equipment tracking share one trait: they stopped treating tracking as a bolt-on project and started building it as infrastructure.
Singapore’s Maritime and Port Authority launched its Maritime Digital Twin on 24 March 2025, signing three-year MOUs with eight partners including Jurong Port, Esri Singapore, and Hexagon. PSA’s Tuas Mega Port, designed for 65 million TEUs per year across 66 berths, embeds tracking at every layer from AGV fleet management (with A*STAR algorithms) to crane dispatch. This is not tracking retrofitted onto a running terminal. It is a terminal built on top of tracking data.
Rotterdam went live with its IoT platform in January 2019, processing 1.2 million data points per day from 44 sensors covering tide, salinity, wind, and visibility. That hydro/meteo foundation, built on environmental monitoring equipment, became the substrate for berth management and port-call optimization. It proved that port IoT earns the biggest return when you layer operational applications on top of infrastructure data.
At the Port of Los Angeles, the geoPOLA GIS system provides role-based dashboards with live traffic, vessel counts, and TEU volumes, distributed to Port Police, LAPD, and the US Coast Guard. During the 2021 congestion crisis, when 60 to 80 vessels sat at anchor, this layer made the bottleneck visible and measurable. Demurrage policy changes and extended gate hours followed. By early 2022, congestion had materially eased. Tracking alone did not fix the problem. It gave operators the data to pair with operational decisions that did.
Antwerp-Bruges earned the 2025 World Port Sustainability Program award for APICA, a digital twin integrating thousands of sensors, drones, 3D sonar, water-quality monitors, and AI object recognition into a real-time model of the entire port area. The same architectural discipline applies to offshore energy asset monitoring, where dispersed assets demand overlapping tracking layers rather than a single technology.
Not every approach worked. Maersk and IBM discontinued TradeLens in November 2022 after the blockchain-based visibility platform failed to reach commercial viability. Rival carriers never participated at scale. The lesson is blunt: shared platforms that depend on competitors’ goodwill do not survive procurement cycles. The ports that succeeded built on widely supported enterprise stacks, not bespoke consortiums requiring industry-wide consensus.
The Cyber Risk Nobody Budgets For
Every IoT sensor, OCR camera, and TOS instance running a terminal operation expands the attack surface. Two incidents frame the scale of the risk.
On 27 June 2017, NotPetya ransomware hit Maersk. The toll: 45,000 PCs destroyed, 1,500 applications disabled, approximately $300 million in losses. The entry point was accounting software in Ukraine, not a port sensor, but the blast radius consumed terminal operations on every continent.
On 24 August 2024, the Port of Seattle identified a ransomware attack that triggered multi-month incident response and notification mailings into April 2025.
If you are deploying GPS trackers on chassis, AI cameras on cranes, and BLE beacons across the yard, you are connecting operational technology (OT) to IP networks. Those endpoints need segmentation from corporate IT, multi-factor authentication on crane and AGV consoles, offline backups, and a tested incident-response runbook. A firewall is not a security program. It is one layer in one.
Building a Port Tracking Stack That Scales
After watching this problem play out across aviation, maritime, and ground logistics, here is how I advise procurement teams to approach port equipment tracking.
Start where ROI is highest: the yard. Yard-side tracking (RTG telemetry, straddle carrier GPS, container-in-stack vision) directly reduces dwell time and detention exposure. Gate OCR, chassis GPS, and crane monitoring all feed into this layer. If budget allows only one phase, fund yard visibility first.
Build a multi-layer tag policy matched to each asset class. A rugged industrial GPS tracking device for chassis and containers that leave the terminal. Active RFID or BLE for yard-resident equipment that never crosses the gate. AI cameras for containers stacked four-high. Passive RFID at portals for automated gate identification. Plan for overlapping coverage at every handoff point, because that is where assets disappear.
Pull carrier IoT APIs before falling back to EDI. With carriers like Hapag-Lloyd instrumenting 85%+ of their dry fleets, container-level GPS is increasingly available via partner integrations. EDI status strings still matter for lines with lower IoT coverage, but the trend is moving away from them.
Require AI-driven stack management in every new TOS or YMS evaluation. Algorithms that suggest container reshuffles to minimize unproductive crane moves are shifting from optional to baseline. North American labor costs are accelerating this shift with every contract cycle.
Budget cybersecurity as a line item, not a footnote. SOC 2 Type II compliance. OT segmentation documentation. MFA on every connected endpoint. If a tracking vendor cannot demonstrate these, keep evaluating.
The container tracking market was valued at $8.7 billion in 2024 and is projected to reach $33.6 billion by 2035, growing at 13% CAGR. That trajectory reflects a shift from project-based purchasing to always-on infrastructure. The ports investing now are building the operational layer that makes everything else (berth planning, predictive maintenance, detention avoidance) possible.
If you are specifying trackers for chassis, containers, or port-side equipment and need a solution that covers the full asset cycle, explore our ocean equipment tracking catalog or talk to our team.
Frequently Asked Questions
What is port equipment tracking?
Port equipment tracking uses GPS, RFID, BLE, computer vision, and terminal operating systems to locate and orchestrate the assets that move containers through a seaport: cranes, RTGs, straddle carriers, AGVs, chassis, trucks, and the containers themselves. A mature deployment layers at least three technologies to cover indoor, outdoor, and handoff-point blind spots.
How does port equipment tracking differ from shipment tracking?
Shipment tracking follows a container from origin to delivery and stops. Port equipment tracking follows every asset through its full lifecycle: movement, return, dwell, maintenance, and reuse. The scope extends beyond cargo to the equipment underneath and around it.
What does poor port visibility actually cost?
Demurrage charges run $75 to $300 per container per day. Detention can peak at $150 per hour. Annual cargo theft losses are estimated at $35 billion, rising 27% in 2024. Equipment downtime compounds these figures through missed vessel connections and longer truck turn times.
Which tracking technology works best at ports?
No single technology covers every asset class. GPS handles trucks and chassis leaving the terminal. Active RFID and BLE track yard-resident equipment. AI cameras localize containers inside stacks. Passive RFID automates gate identification. The most effective implementations overlap three or more layers at transition points.
Is cybersecurity a real concern for port tracking systems?
Yes. The NotPetya attack cost Maersk approximately $300 million in 2017. The Port of Seattle was hit in August 2024. Every connected sensor and camera expands the OT attack surface. Network segmentation, multi-factor authentication, and tested incident-response plans are non-negotiable for any deployment.
How large is the port equipment tracking market?
The container tracking market alone was $8.7 billion in 2024, projected to $33.6 billion by 2035 at 13% CAGR. The broader marine IoT market is estimated at $682 billion (2024), expected to reach $2.4 trillion by 2032. North America holds roughly 40% of container tracking market share.




 +1 508 292 2210

5 Responses