

The water quality monitoring market is projected to reach $8.6 billion by 2030, growing at 7.2% annually. USGS operates more than 13,500 real-time monitoring stations across streams, lakes, reservoirs, and groundwater sites in the US alone. Water quality monitoring sensors are everywhere.
The hardware has never been better. And yet most sensor deployments still break at the same points: biofouling nobody budgeted to manage, calibration drift that turns continuous data into continuous noise, and readings that sit in a database without reaching anyone who can act on them.
I’ve spent 15+ years in industrial IoT, integrating sensor networks across aviation, maritime logistics, and environmental monitoring. The pattern holds regardless of industry. Organizations buy sensors for their spec sheets, then discover that specs explain maybe a third of what makes a deployment succeed. The rest is maintenance workflow, data pipeline architecture, communication protocols, and the organizational discipline to respond when numbers go sideways.
This guide covers water quality monitoring sensors from the perspective of someone who deploys and maintains sensor networks for a living. Not a product catalog, not a government reference manual. A practical framework for choosing, deploying, and keeping these systems honest over time.
What Water Quality Monitoring Sensors Actually Measure
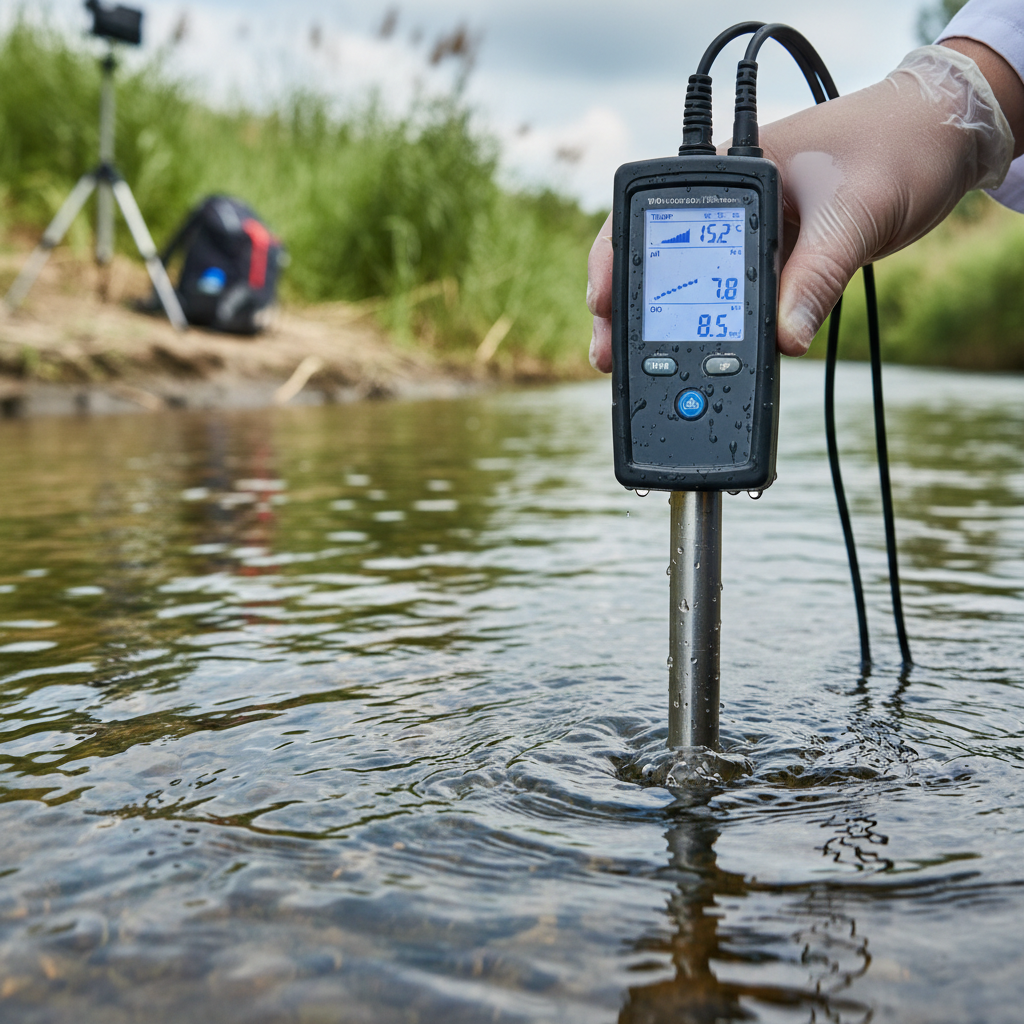
Water quality monitoring sensors are instruments that measure physical, chemical, or biological parameters in water bodies, treatment systems, or distribution networks. They can operate as handheld spot-check devices, continuous fixed-point monitors, or nodes in a distributed IoT network. EPA’s Water Sensors Toolbox identifies the core field parameters as pH, temperature, conductivity, dissolved oxygen (DO), and turbidity. Extended capabilities cover chlorophyll, cyanobacteria, nutrients, salinity, oxidation-reduction potential (ORP), chlorine, depth, and flow.
What matters more than the parameter list is how the sensor produces its reading. pH and ORP typically rely on electrochemical electrodes. Dissolved oxygen increasingly uses optical luminescence instead of older membrane-based methods. Turbidity instruments infer suspended-particle concentration from light scattering. Fluorescence sensors screen for chlorophyll or algae pigments by measuring light emission at specific wavelengths.
Each transducer technology carries a different drift profile, fouling susceptibility, power demand, and interference signature. An optical DO sensor and an electrochemical DO sensor both report dissolved oxygen. Their maintenance intervals, failure modes, and responses to temperature swings are not interchangeable. Two sensors measuring the same parameter can have very different total costs of ownership depending on the water matrix and deployment environment.
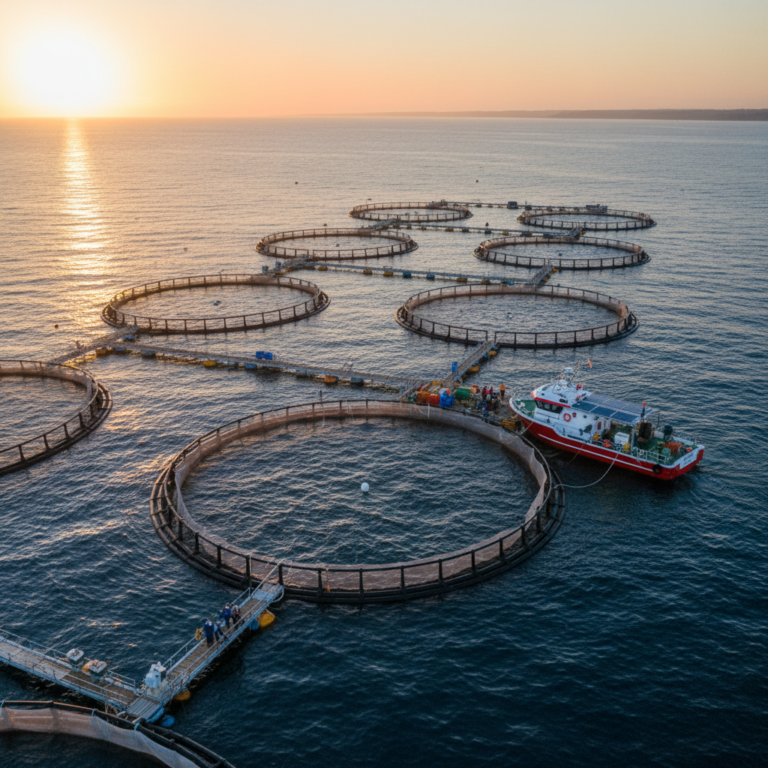
The productive starting question is never “which sensor measures the most parameters.” It is: what decision does this measurement need to support? A drinking water utility watching for contamination events needs different temporal resolution and evidence quality than an aquaculture operation tracking DO for aeration control. aquaculture water quality monitoring illustrates this well, where a 2024 IoT aquafarming study monitoring temperature, pH, and dissolved oxygen demonstrates the point: three parameters tightly integrated with an action (adjusting aeration) can deliver more operational value than twenty parameters on an unmonitored dashboard. The same principle applies to vertical farming sensors, where the decision the measurement supports determines which instruments actually pay back.
Sensor Architectures: Matching Hardware to the Decision
Not all water quality monitoring sensors serve the same operational model. The architecture you choose determines time resolution, spatial coverage, maintenance burden, and evidence quality.
| Architecture | Strength | Primary limitation | Best fit |
|---|---|---|---|
| Portable handheld meter | Maximum flexibility and relocatability for field checks | Intermittent data; operator technique affects consistency | Surveys, incident response, calibration verification |
| Fixed multiparameter sonde | Continuous time series at a single point; modular systems can measure up to 20 parameters simultaneously | Fouling, calibration drift, power supply, site access | Rivers, lakes, reservoirs, source water intakes |
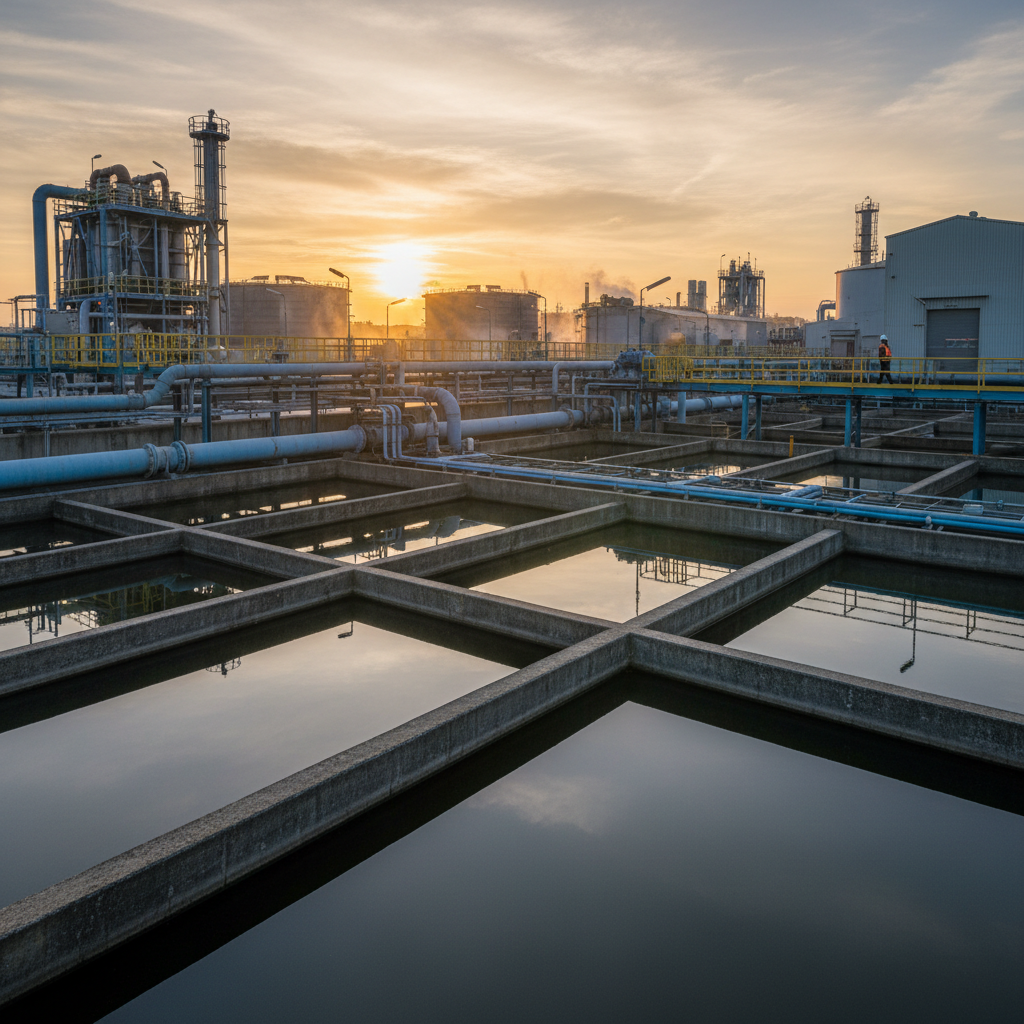
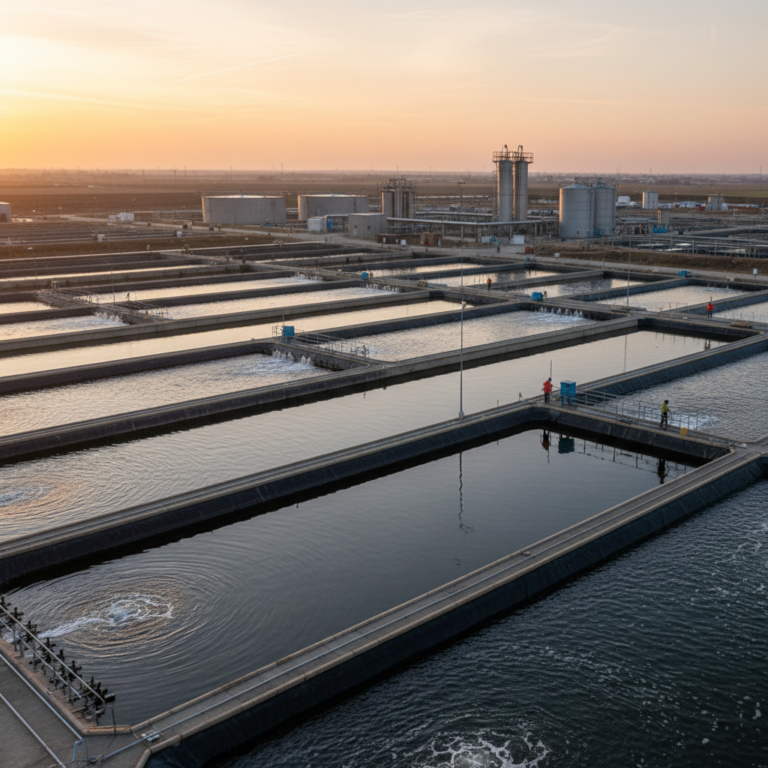
| Online/inline analyzer | Real-time process control integrated with treatment or distribution systems | Higher installation cost; harsh process matrix; reagent management | Drinking water treatment, wastewater, industrial processes |
| Low-cost IoT node | Many distributed points at low entry cost with remote alerting | Calibration variability, precision gaps, environmental degradation | Screening networks, research, education, aquaculture pilots |
| Remote sensing / autonomous platform | Broad spatial coverage; reaches locations fixed stations cannot | Indirect proxy measurements; atmospheric interference; field validation required | Harmful algal bloom mapping, watershed-scale surveys, exploratory sampling |
A fixed sonde gives you excellent temporal resolution at one point but reveals nothing about conditions 500 meters upstream. An autonomous platform like the JaiaBot micro-AUVs that USGS is testing in Pennsylvania can cover larger water segments, but its measurements are still being compared against traditional methods. A low-cost IoT network might give you 50 monitoring points for the price of two laboratory-grade sondes, but systematic reviews report precision, accuracy, and degradation problems that demand independent reference checks.
The most effective water quality programs don’t pick one architecture. They layer them. EPA’s harmful algal bloom research program is a clear example: it combines high-frequency in-situ sensors with local grab sampling and satellite imagery through the CyAN application. Fixed sensors deliver temporal detail. Satellite data delivers spatial context. Lab samples deliver ground truth. No single layer replaces the others.
Calibration and Fouling: The Cost Nobody Quotes
Here is where most sensor programs hit their real budget. A probe that reads perfectly during commissioning will drift. Every sensor drifts. The only questions are how fast, how far, and whether anyone notices before the data becomes operationally useless.
Biofouling is the worst offender in field deployments. One in-situ fluorescence study found that biological fouling increased the sensor signal by approximately 82%, while mineral scaling reduced sensitivity in the opposite direction. That is not a minor calibration offset. That is a sensor reporting nearly double the actual value because algae colonized the optical window. The exact effect varies by site, season, and sensor type, but the order of magnitude is a warning about every unattended deployment.
Research on low-cost sensors underscores the difficulty: calibration outcomes vary with sensing materials, transducer design, and the environmental conditions at the deployment site. A sensor calibrated in clean lab water at 20°C may behave very differently in a turbid river at 35°C with high dissolved solids. The cheaper the device, the less internal compensation it typically provides.
USGS recognized this problem early. Their guidelines for continuous water-quality monitors cover site selection, sensor inspection, calibration procedures, field verification, data evaluation, and reporting. This is a full quality assurance framework. Not because the hardware is unreliable, but because even the best hardware operates in an environment that actively degrades measurement quality.
The practical takeaway: budget for the sensor and the program around it. That includes calibration standards, cleaning systems (mechanical wipers, chemical treatments, or scheduled manual maintenance), grab samples for periodic cross-checks, data flagging protocols for suspect readings, and someone whose job includes reviewing whether the numbers still track reality. It is always better to plan for maintenance cost upfront than to discover three months later that your data has been unreliable since week two.
How to Select the Right Water Quality Sensor
Before opening a product catalog, answer these five questions. They will do more for your deployment success than any feature comparison.
- What analyte, and what threshold? A DO sensor for aquaculture aeration triggers at milligram-per-liter levels. A PFAS screening tool operates at single-digit nanograms per liter. These demand completely different measurement technologies, calibration protocols, and evidence chains.
- What action does the measurement trigger? If the answer is “adjust a treatment chemical in real time,” you need an inline analyzer with process integration. If it is “flag an anomaly for investigation within 24 hours,” a networked sonde with cloud alerts may be sufficient. If it is “confirm compliance for a regulator,” the measurement may need to follow a specific approved method where a continuous sensor alone does not satisfy the requirement.
- What is the maintenance capacity at the deployment site? A multi-thousand-dollar sonde at a remote headwater station with quarterly site visits will spend most of its operating life drifting unattended. The same sensor at a treatment plant with daily operator rounds can be verified frequently. YSI’s instrument selection guidance identifies budget and maintenance capability as key decision factors. I would rank maintenance capacity even higher than purchase budget: a less expensive sensor that gets cleaned weekly will outperform an expensive one that gets ignored.
- What data pipeline does the sensor feed? A reading on a local display is a measurement. A reading that flows into a SCADA system, triggers an alarm, generates a log entry, and feeds a compliance report is operational infrastructure. EPA identifies data logging, transfer, warehousing, firewalls, data ownership, and storage cost as system design considerations. If you have not mapped the data path from probe to decision-maker, you have not designed a monitoring system.
- What evidence burden applies? Operational control, early warning, regulatory compliance, and public health reporting carry different requirements for measurement defensibility. EPA evaluates sensitivity, precision, and reliability but does not endorse particular commercial sensors. Vendor accuracy claims are starting points for your own validation plan. They are not endpoints.
This framework applies whether you are instrumenting a municipal intake, a wastewater effluent, a shrimp farm, or a drinking water distribution network. Hardware selection comes after these five answers, not before.
What Is Emerging in 2026: PFAS, AI, and Sensor Fusion
Three developments are reshaping water quality monitoring right now. None of them is a finished product. All of them will influence procurement decisions within the next 24 months.
PFAS field detection carries the most regulatory urgency. EPA’s drinking water rule sets maximum contaminant levels at 4.0 ng/L for PFOA and PFOS, 10 ng/L for PFHxS, PFNA, and HFPO-DA, and a hazard-index MCL of 1 for specified mixtures. Public water systems face initial monitoring deadlines in 2027 and remediation deadlines in 2029. Emerging portable platforms report 12 to 15 minute time-to-result, and newer devices claim detection at regulatory concentrations. The demand is enormous. But field claims and validated compliance results are different things. Treat portable PFAS sensors as promising screening tools until selectivity, repeatability, and regulatory acceptance are demonstrated for your specific water matrix.
AI and IoT convergence is moving from theory to deployment. A 2025 paper describes next-generation sensing networks where machine learning processes sensor data at the edge for real-time anomaly detection. The practical mechanism: more observations make patterns visible, and algorithms can prioritize human attention toward actual events rather than noise. EPA’s CANARY system, which applies statistical algorithms to water quality data for distribution system anomaly detection, has been doing a version of this for years. The risk with scaling AI across sensor networks is the same as with any model. An algorithm applied to poorly calibrated, biofouled sensors automates bad data, faster.
Autonomous sampling is the longer play. USGS is testing JaiaBot micro-AUVs fitted with dissolved oxygen, pH, fluorescence, and camera payloads, comparing concurrent measurements with traditional methods. The value proposition is obvious: cover larger water bodies with fewer fixed stations and adapt sampling paths based on initial readings. Communications, battery life, and autonomous decision-making remain active development areas. This is a trajectory to plan for, not a purchase to make next quarter.
The thread connecting all three: sensor fusion outperforms any single instrument. The winning programs combine in-situ sensors for temporal resolution, remote sensing for spatial context, laboratory methods for ground truth, and analytics for pattern recognition. Integration is the differentiator.
Governance and Cybersecurity: Where Hardware Cannot Help
A sensor network is only as good as the institution operating it.
The Flint water crisis remains the clearest illustration. The crisis stemmed from a failure to apply corrosion-control chemicals, not a failure of monitoring hardware. Research has documented how biased sampling design and selective reporting can mask true contamination levels, creating a false impression of safety even when instruments are technically functional. Sensors do not fix bad decisions. And a monitoring network designed around convenient locations rather than vulnerable ones can generate false confidence that is worse than having no data at all.
Cybersecurity is the governance gap most programs still ignore. Water quality sensors connected to IoT platforms, SCADA systems, and cloud dashboards are network endpoints. They can serve as vectors for data manipulation, unauthorized access, or operational disruption. EPA’s cybersecurity guidance for the water sector emphasizes foundational hygiene: prevent, detect, respond, recover. A sensor network that exports data over the public internet without encryption, authentication, or firmware update management is a monitoring system that can be compromised.
Two practical steps most deployments skip:
- Require raw data preservation with full timestamps, calibration status, and quality flags. If the platform only exports smoothed or averaged values, you lose the ability to audit whether a specific reading was valid. That matters the day a reading triggers a regulatory response or a public health decision.
- Define data ownership before deployment, not after. Who controls the readings? Who can export the full dataset? What happens to historical data if you change platform vendors? These are questions that are easy to defer during procurement and expensive to resolve two years into a contract.
Frequently Asked Questions
What are the most common parameters water quality sensors measure?
The standard field set includes pH, temperature, conductivity, dissolved oxygen, and turbidity. Extended capabilities cover chlorophyll, cyanobacteria, nutrients, salinity, chlorine, and oxidation-reduction potential. Multiparameter sondes can measure up to 20 parameters simultaneously, though most deployments focus on the analytes directly tied to an operational or compliance decision.
How often should water quality sensors be calibrated?
No universal interval exists. Calibration frequency depends on sensor chemistry, water matrix, fouling conditions, deployment duration, and the consequence of measurement error. Some deployments require weekly verification; others manage monthly. Establish the right interval through side-by-side comparison with reference samples and documented drift tracking rather than a fixed calendar.
Are low-cost IoT water quality sensors reliable?
They can be appropriate for exploratory mapping, relative change detection, research networks, and dense screening where independent reference checks are built into the program. They carry higher risk when a single reading drives a public health or enforcement action. Research consistently reports precision and accuracy degradation after environmental exposure. Validate against independent lab samples and flag data quality transparently.
Can sensors replace laboratory water testing?
Not for all purposes. Continuous sensors excel at trend monitoring, real-time alerts, and process control. Regulatory compliance determinations often require specific approved laboratory methods. Use sensors to detect changes and trigger investigation. Confirm high-consequence findings with the reference method accepted by your applicable regulator.
What is sensor fusion in water quality monitoring?
Sensor fusion combines data from multiple sources (fixed sensors, portable instruments, satellite imagery, laboratory samples) to build a more complete picture than any single method provides. EPA’s harmful algal bloom program is a working example: in-situ sensors provide temporal detail, satellites provide spatial coverage, and lab samples provide confirmation. The approach compensates for limitations inherent in each individual method—similar to how air quality monitoring systems integrate multiple sensor types to validate readings across environmental contexts.
How do water quality sensors transmit data to a dashboard?
A typical system connects the probe to a data logger, applies quality rules and compensation locally, then transmits via cellular, satellite, radio, or wired connection to a cloud platform or SCADA system. Key design considerations include site connectivity, data storage costs, latency tolerance, cybersecurity requirements, and whether the system preserves raw readings with quality flags or exports only processed values.
Water quality monitoring sensors are a means, not an end. The sensor creates value at the moment its reading changes someone’s action: adjust a treatment, close a beach, investigate a source, confirm compliance. The hardware, calibration, data pipeline, and security all exist to make that moment reliable.
If your monitoring program needs help connecting sensor hardware to a data pipeline that delivers actionable readings, that is where we work. Take a look at our environmental tracking solutions, or talk to our team about what integration looks like for your specific deployment.





 +1 508 292 2210

4 Responses