

White spot syndrome virus can wipe out a pond in seven to ten days. Annual global losses from WSSV alone approach USD 19 billion, and the disease often starts with signals invisible to the naked eye: a subtle oxygen dip, a shift in feeding behavior, a temperature swing after a night storm. By the time you see white spots on the carapace, the window for that pond has closed.
This is why shrimp farm monitoring exists. Not as a dashboard to admire, but as an early-warning system that converts sensor data into action before a loss becomes irreversible.
The catch? Most of the conversation fixates on hardware specs. Which probe reads pH to the third decimal. How many data points per minute. Which cloud platform looks sleekest on a laptop screen. Those details matter, but they’re the wrong starting point. The real question is simpler: when dissolved oxygen drops below 4 mg/L at 2 AM, does your system wake someone up and tell them what to do? Or does it log a number for a report nobody reads until morning?
I’ve spent over 15 years deploying IoT in aviation, maritime logistics, and industrial supply chains. The pattern repeats across every vertical: technology works when it’s designed around decisions, and fails when it’s designed around data collection. Shrimp ponds are no exception. What follows is a practical breakdown of what to measure, how the system should work, where automation helps, where it hurts, and how to evaluate vendors without buying a science project.
What Shrimp Farm Monitoring Actually Means
Shrimp farm monitoring is the continuous or periodic collection of water quality, biological, equipment, and environmental data from grow-out ponds, hatcheries, or raceways, combined with analysis and response workflows that convert readings into operational decisions about aeration, feeding, water exchange, harvest timing, biosecurity, or compliance records.
In its simplest form, it’s a calibrated dissolved oxygen probe connected to an alarm. In its most advanced form, it’s a layered system of sensors, cameras, machine learning models, automated feeders, and aerators that predict problems before they arrive.
The distinction that matters is between monitoring and logging. Logging records what happened. Monitoring changes what happens next. A pH reading stored on a server is a log. A pH reading that triggers a water exchange protocol and texts the farm manager at 3 AM is monitoring.
The economics back this up. The precision aquaculture market is projected to grow from USD 848 million in 2025 to USD 1.43 billion by 2030. That growth reflects a structural shift: as stocking densities rise and margins tighten, the cost of ignorance increases faster than the cost of sensors. More ponds, more animals per pond, tighter environmental limits. The farms that survive will be the ones that see trouble coming.
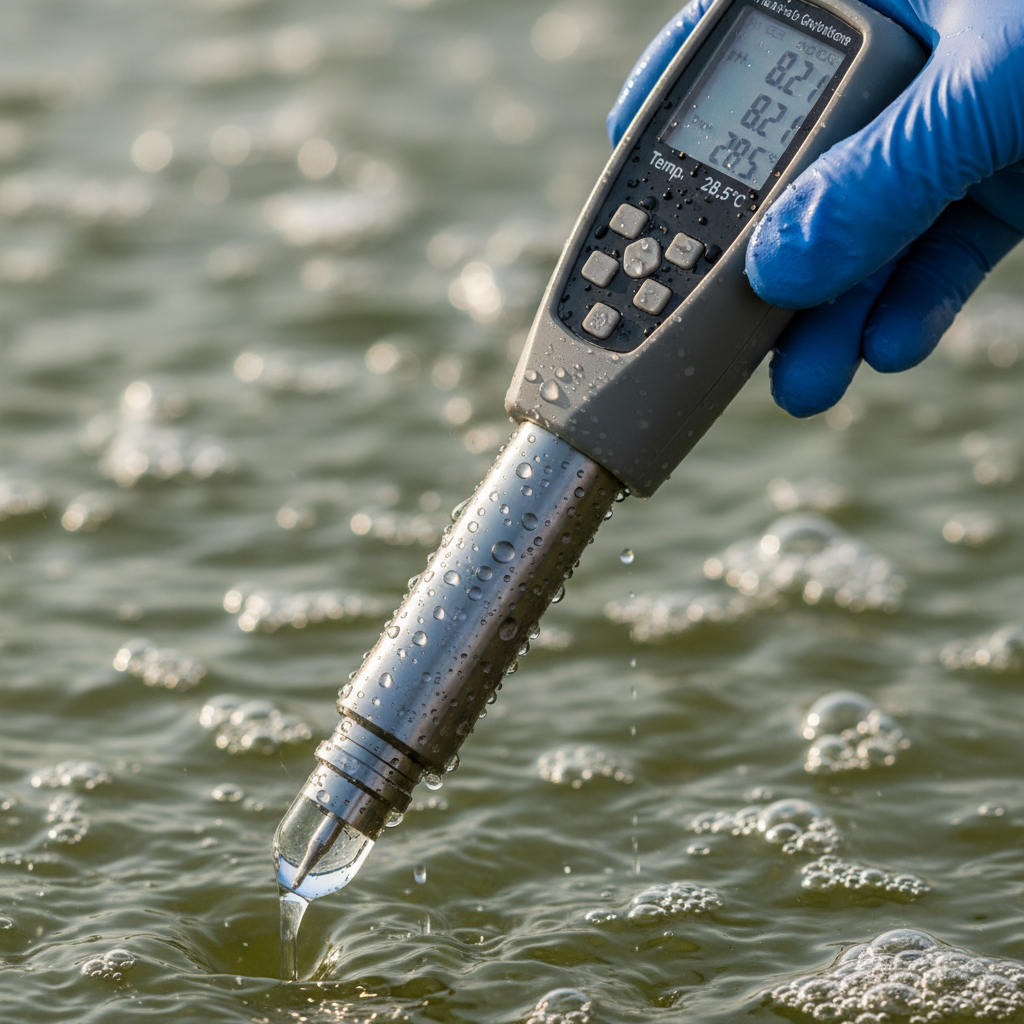
The Parameters That Drive Decisions
Not every parameter needs a dedicated sensor on day one. The practical approach is to start with the variables that kill shrimp fastest, then expand as the system proves reliable and the team learns to trust (and maintain) the data.
| Parameter | Why It Matters | Alert Threshold (L. vannamei) | Immediate Response |
|---|---|---|---|
| Dissolved Oxygen (DO) | Below critical levels, shrimp suffocate. The crash window is typically 2 AM to dawn, when photosynthesis stops and respiration peaks. | 4.5 mg/L alert; 3.5 mg/L emergency | Activate aerators, stop feeding, increase water exchange |
| Temperature | Drives metabolic rate, oxygen solubility, and disease susceptibility. Sudden shifts stress animals faster than gradual ones. | Outside 28-32°C | Adjust water depth, shading, or exchange rate |
| pH | Higher pH makes ammonia more toxic at the same concentration. Swings often signal algae bloom or die-off. | Outside 7.5-8.5 | Check alkalinity, reduce feeding, investigate algae |
| Salinity | Sudden dilution from heavy rain can stress or kill. Species-specific tolerance varies by acclimation history. | Outside 15-25 ppt (varies) | Control water inlet, reserve saline water for dilution events |
| Ammonia (NH3/TAN) | Toxic in un-ionized form. Spikes after overfeeding, die-offs, or insufficient water exchange. | NH3 above 0.1 mg/L | Reduce feeding, increase aeration and exchange, check biofilter |
| Turbidity | Indicates algae density and suspended solids. Sudden changes often precede oxygen crashes from bloom collapse. | Context-dependent | Investigate cause, reduce feeding, prepare emergency aeration |
| Water Level | Detects leaks, evaporation, overflow, and rain events that dilute salinity and treatments. | Farm-specific | Activate pumps, check levees, adjust inlet/outlet |
The common mistake is buying sensors for all seven parameters simultaneously, then failing to maintain any of them properly. Biofilm, salt corrosion, and calibration drift are constant realities in aquaculture sensor deployment, not edge cases. A system with two reliable, well-maintained probes (DO and temperature) that trigger real responses will outperform seven drifting sensors feeding a dashboard nobody checks.
Six Layers Between a Reading and a Saved Crop
A shrimp monitoring system is not a sensor. It’s a stack. Each layer has a job, a failure mode, and a cost when it breaks. Understanding the stack helps you buy the right system rather than the cheapest or most impressive one.
| Layer | What It Does | Typical Components | How It Fails |
|---|---|---|---|
| 1. Measurement | Captures the physical state of the pond | DO, temperature, pH, salinity, ammonia, turbidity probes | Fouling, drift, corrosion, calibration neglect |
| 2. Connectivity | Moves readings from pond to processor | LoRa, NB-IoT, 4G, Wi-Fi, gateways, microcontrollers | Power loss, signal dead zones, bandwidth limits |
| 3. Analytics | Converts raw data into alerts and recommendations | Rules engine, trend analysis, anomaly detection, ML models | Bad training data, no local context, overfitting |
| 4. Actuation | Closes the loop between signal and physical response | Aerators, automatic feeders, pumps, oxygenation | Automating on a bad sensor reading amplifies the error |
| 5. Biological Observation | Estimates animal state: size, behavior, stress, feeding | Underwater cameras, sonar, computer vision models | Turbidity, lighting, species-specific model gaps |
| 6. Governance | Supports audits, traceability, cross-cycle learning | Logs, APIs, export formats, permissions, compliance records | Vendor lock-in, unclear data ownership, cybersecurity |
Most vendor pitches emphasize layers 1 and 3: sensors and analytics. The layers that determine whether a system survives a full crop cycle are 2 (connectivity) and 4 (actuation). A gorgeous AI dashboard means nothing if the LoRa gateway loses power during a storm and the aerator never kicks on.
Layer 5 is where the technology is evolving fastest. The ShrimpWiz project (a collaboration between Oceanloop and the Alfred Wegener Institute) reports 95% accuracy for real-time shrimp counting and length measurement in controlled indoor environments. A separate study using YOLOv8 segmentation achieved a mask F1 score of 0.898 and a length-estimation error of just 1.56%, but flagged that turbidity and weak lighting significantly degrade detection. UMITRON announced what it called the world’s first real-time AI-based shrimp analytics solution in mid-2026, signaling that the category is accelerating. The takeaway: vision systems are genuinely promising for biomass estimation and welfare monitoring, but outdoor-pond performance in turbid water is a different proposition than a clean-water research tank. Ask vendors for accuracy numbers by turbidity level, not just overall.
When Monitoring Meets Its Limits: Disease and Climate
Here’s the reality check most monitoring vendors skip: sensors detect conditions, not pathogens. A dissolved oxygen probe can flag that something is consuming oxygen faster than expected. It cannot tell you whether the cause is a bacterial bloom, a sudden algae crash, or an early-stage viral infection.
The two diseases that have cost the shrimp industry the most illustrate this point:
- White Spot Syndrome Virus (WSSV) can reach near-total mortality within 7 to 10 days, with estimated annual global losses of approximately USD 19 billion. The characteristic white spots (1-3 mm) are not present in every infection and are not sufficient for diagnosis. Confirmation requires PCR, preferably with sequencing for surveillance.
- Acute Hepatopancreatic Necrosis Disease (AHPND) has caused estimated global losses of approximately USD 43 billion, with production in affected regions dropping to around 60% of previous levels.
What monitoring does in these scenarios is flag precursors: unusual oxygen consumption, sudden feeding reduction, abnormal swimming patterns, rising mortality in check trays. A well-configured alert system buys you hours, sometimes a day or two, of investigation time before a disease event becomes an irreversible pond loss. That window is for diagnostic action: PCR sampling, pond isolation, treatment protocols. Not for staring at trend lines.
Climate events present a similar pattern. Heavy overnight rain can dilute salinity by several parts per thousand in hours. A real-time salinity sensor paired with a weather alert gives you a head start on brining up the pond or closing inlet gates. Without it, you discover the problem when shrimp stop eating the next morning.
The honest framing: monitoring is an early-warning and triage layer. It makes your response faster and more targeted. It does not replace biosecurity protocols, diagnostic labs, or experienced farm managers who know what 50-day-old vannamei should look like at feeding time.
Closed-Loop vs. Alert-Only: The Distinction Worth Paying For
There’s a spectrum of automation in shrimp farm monitoring. Where you sit on it determines both your upside and your risk.
Alert-only systems detect a threshold breach and notify a human. The human decides what to do. This is the safest starting point for any farm adopting monitoring for the first time. The cost of a false alarm is a phone call. The cost of a missed alarm is a conversation about backup power and redundant notification channels.
Closed-loop systems detect a breach and automatically execute a response: turn on aerators, stop feeders, open water gates, dose oxygen. Indonesian farms using smart aerators and IoT-connected feeders report harvest cycles shortened by up to 10 days and production cost reductions of up to 30%. Those are field-reported outcomes rather than controlled trials, so treat them as directional signals, not guarantees for your farm.
The risk with closed-loop automation is straightforward: if the sensor is wrong, the system amplifies the error. A fouled DO probe reads artificially low. All aerators fire at full power, wasting energy and potentially disrupting the pond. Or a drifting pH sensor suppresses feeding for three days because the system calculates high ammonia toxicity that doesn’t exist. Both scenarios damage the crop by trusting bad data.
The practical path forward:
- Start alert-only with DO and temperature. Build trust in data quality over one full grow-out cycle.
- Add automated aeration tied to DO, with manual override and a redundant probe.
- Introduce automated feeding adjustments only after validating that sensor inputs are consistently accurate across conditions (rain, heat, algae blooms).
- Reserve full closed-loop control for farms with dedicated technical staff, probe-maintenance schedules, and manual fallback procedures.
This staged approach matches what works in industrial IoT broadly. Automate the response, not the assumption. And always, always maintain a manual override.
Monitoring as Market Access: Traceability and Compliance
Shrimp farm monitoring increasingly isn’t optional for exporters. It’s a prerequisite for selling into premium markets.
The U.S. Seafood Import Monitoring Program covers 13 species groups including shrimp, requiring importers to report and maintain records on harvest, landing, and chain of custody. FDA traceability requirements that took effect in January 2026 keep shrimp on the Food Traceability List, specifying records for lot code, species, quantity, harvest date and location, receiver location, and reference documents.
In practice, this means a farm that produces time-stamped, sensor-verified records of water quality, feeding events, treatment applications, and harvest conditions has a real commercial edge, much like a well-run hydroponic monitoring system in controlled-environment agriculture. When a European retailer or a U.S. food-service chain asks for documentation, the farm with continuous digital records answers in minutes. The farm relying on handwritten logbooks answers in days, if it can answer at all.
This is where the governance layer (layer 6 in the stack above) earns its keep. Data export, API access, lot-level identity, chain-of-custody linking. The same principles apply to any controlled-environment operation, including a vertical farm monitoring system or a vertical farm climate control setup. If your monitoring vendor doesn’t offer clean data portability, and you can’t export your own records without their platform, you’ve traded one dependency for another. Ask about data ownership and exit terms before signing, not after.
How to Evaluate a Monitoring System
The shrimp monitoring market is crowded with claims. Here’s how to cut through the noise.
Ask for shrimp-specific field data. Not aquaculture generics. Not salmon pen results. Shrimp ponds have unique turbidity, salinity, biofouling, and stocking-density challenges. If every case study on the website is from a fish farm, ask what’s different about their shrimp deployment.
Demand uptime numbers across a full crop cycle. A system that performed perfectly during a two-week pilot in dry season tells you almost nothing about behavior during monsoon, rolling blackouts, or a 120-day grow-out. Ask for data from at least three consecutive cycles.
Check the false-alarm rate. An alert system that cries wolf every night trains your team to ignore it. A good vendor can tell you the ratio of actionable alerts to false positives in their deployed base. If they can’t, the product is too young or the data too sparse.
Offline behavior deserves special attention. What happens when connectivity drops? Does the system buffer data locally and maintain alarm logic at the edge? Or does it go silent until the network returns? The GSMA Indonesia study documents farmers abandoning monitoring devices when pilot support ended, citing subscription costs, connectivity glitches, and maintenance difficulties as primary reasons. A system you can’t afford to keep running after the demo period is worse than no system at all.
Calculate total cost over a crop cycle, not just the purchase price. Hardware is the visible expense. Subscription fees, probe replacements every few months, calibration solutions, cleaning supplies, technician visits, battery swaps: these invisible costs often exceed the initial hardware over a full production year.
Verify data ownership and portability. Can you export historical data in a standard format (CSV, API) if you switch vendors? Who owns the data? What happens to your farm records if the vendor shuts down? These questions sound like legal nitpicking until they’re not.
Frequently Asked Questions
What is the most important parameter to monitor in a shrimp pond?
Dissolved oxygen. It’s the parameter most likely to cause acute mortality, especially during the overnight hours when photosynthesis stops and oxygen demand from shrimp and bacteria peaks. A reliable DO sensor with a threshold-based alert system should be the first investment for any farm.
Can shrimp farm monitoring prevent disease outbreaks?
Not directly. Monitoring detects environmental conditions and behavioral changes that often precede disease events, giving you a window to investigate, sample, and isolate. Confirmation of pathogens like WSSV or AHPND still requires laboratory diagnostics such as PCR. Monitoring is an early-warning layer, not a replacement for biosecurity protocols.
How much does a basic monitoring system cost?
A basic setup with DO and temperature probes, a gateway, and cloud-connected alerts can range from a few hundred to a few thousand USD per pond, depending on sensor quality and connectivity. Ongoing costs (probe replacement, calibration, subscriptions) often exceed the initial hardware over a full crop cycle. Budget for total cost of ownership.
Is AI necessary for shrimp farm monitoring?
Not at the starting level. Rule-based alerts handle the highest-priority use cases effectively. AI and machine learning add value once you have enough historical data to train predictive models, like forecasting an oxygen crash six hours ahead. Add AI after your basic sensor infrastructure is reliable, calibrated, and well-maintained.
What connectivity works best for remote shrimp farms?
LoRa suits farms with many ponds spread over large areas because it supports long-range, low-power transmission without cellular infrastructure. Farms with 4G coverage can deploy cellular-connected sensors more simply. The non-negotiable requirement is local data buffering and edge-based alarm logic so the system functions during network outages.
Does monitoring help with sustainability certification?
It creates evidence that supports certification, but it’s not sufficient by itself. Programs like ASC and BAP require documentation of water quality, feed management, and environmental impact. Continuous digital records simplify audits and strengthen applications. Certification also requires biosecurity protocols, labor standards, and habitat management that go beyond sensor data.
Building a monitoring stack for a corrosive, remote, power-limited environment is fundamentally an IoT integration problem. It’s the same problem whether you’re tracking a ULD through an airline’s MRO cycle or keeping vannamei alive in Sumatra. If you’re evaluating environmental tracking solutions for aquaculture or any field operation where conditions destroy fragile hardware, let’s talk.








 +1 508 292 2210

4 Responses